

The #1 Regret Sellers Have When They Don’t Use an Agent
Want to know the #1 thing homeowners regret when they sell without an agent? It’s that they didn’t price their house correctly for their current market.
According to the latest data from the National Association of Realtors (NAR), those sellers agree pricing their home effectively was the hardest part of the process.
Top 5 Most Difficult Task for Sellers Who Didn’t Use an Agent:
- Getting the price right
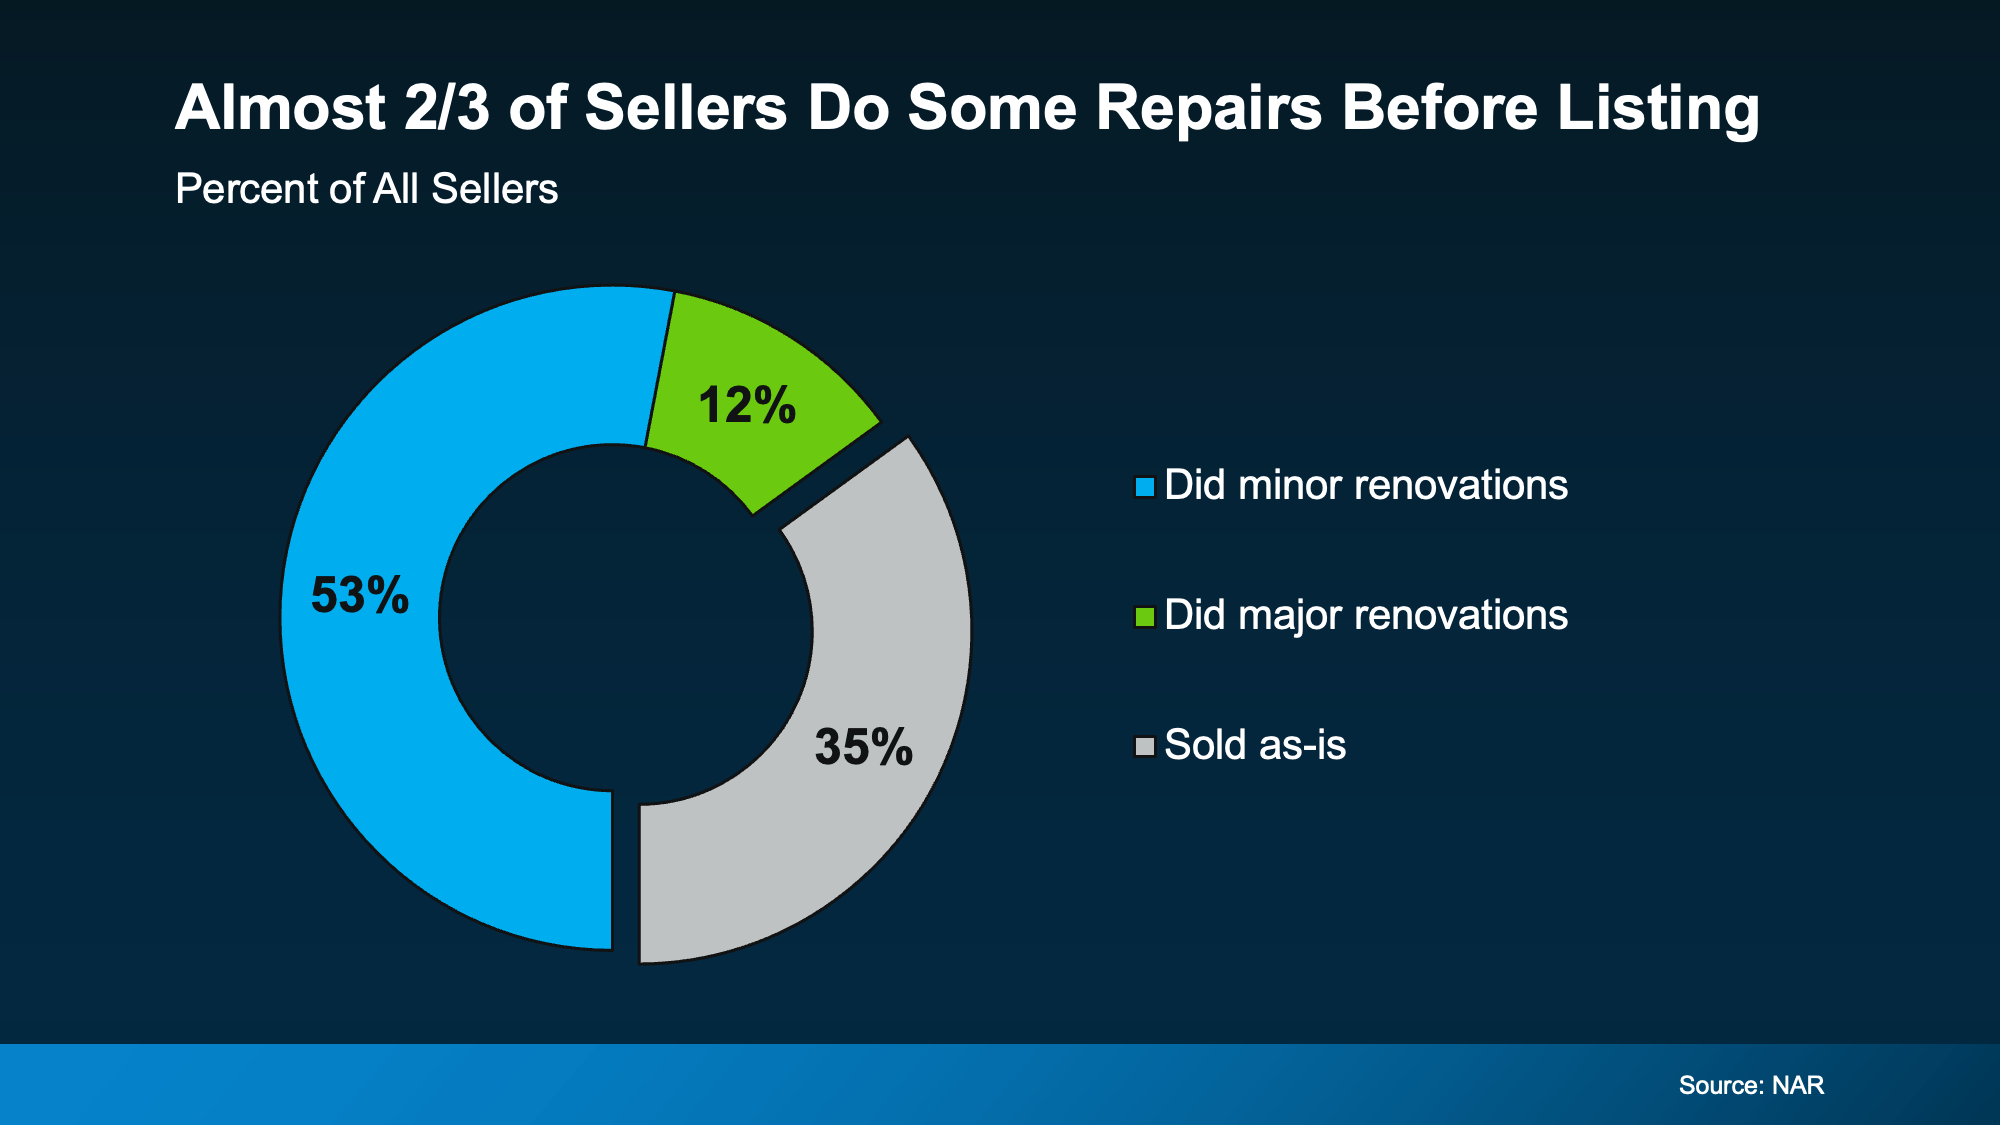
- Preparing or fixing up the house
- Selling within the desired time frame
- Handling all the legal documents
- Finding the time to manage all aspects of the sale
And that makes sense. Pricing isn’t as simple as picking a number from an online estimate or copying what your neighbor got last year. It takes real insight into:
- What buyers are actually willing to pay today
- How much competition you have in your area
- What similar homes nearby are really selling for
- How desirable your area or neighborhood is
- The condition of your house
Without that context, it’s easy to overshoot the mark, especially now that buyers can be more selective. And in today’s market, that’ll backfire.
Overpricing Isn’t a Small Mistake, It Snowballs
Your price is part of what shapes a buyer’s first impression. And when it’s too high, a chain reaction begins.
If buyers think you’re asking too much, they’re going to turn the other way. And when buyers bypass your house, you’ll get fewer showings. Fewer showings lead to fewer offers. And fewer offers usually mean making a price cut to try to draw buyers back in.
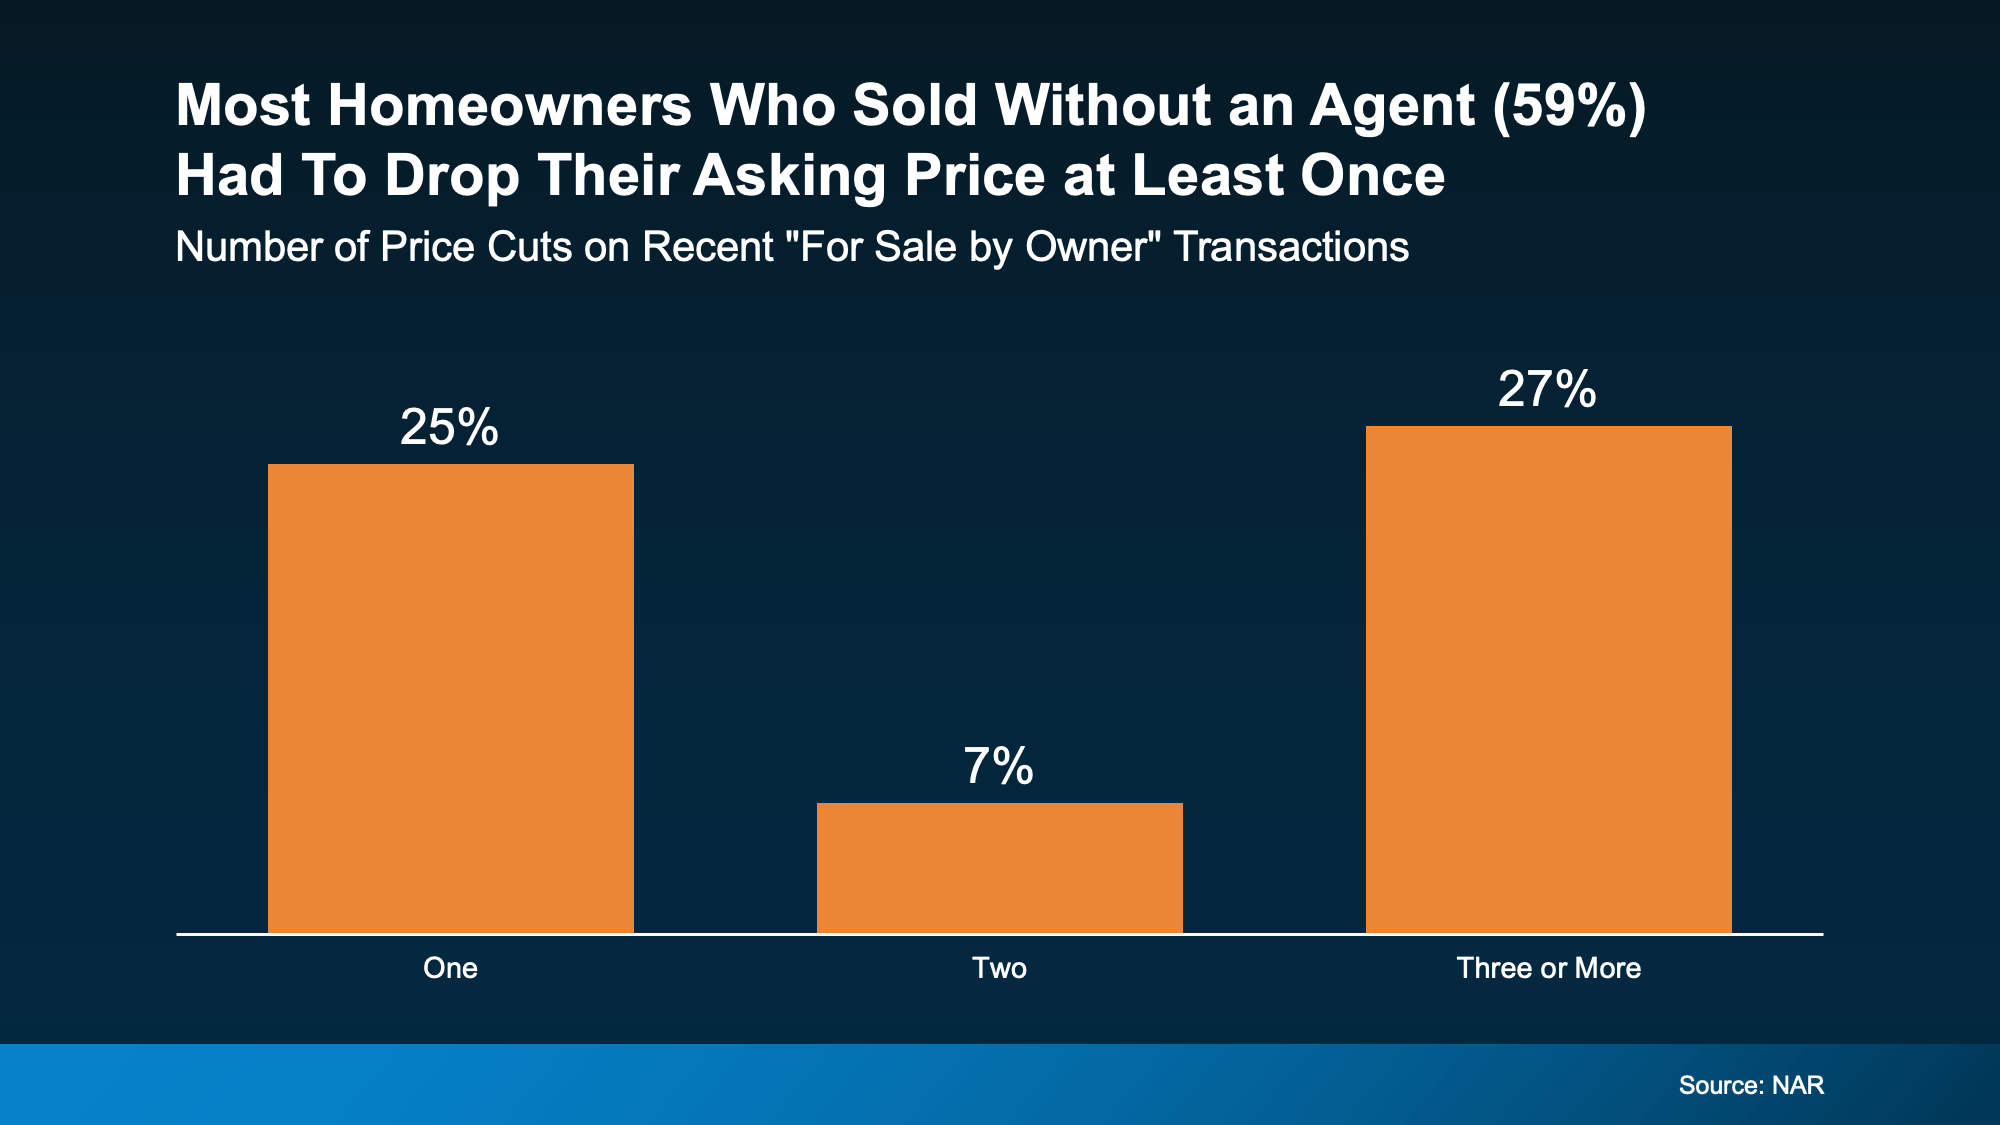
And that’s happening a lot lately, especially on homes sold without a pro.
The same NAR report shows most homes sold without an agent (59%) had to reduce their asking price at least once (see the orange in the graph below).
 The Part Sellers Don’t See Coming
The trouble is, price cuts don’t always fix the problem. They can attract bargain hunters rather than strong, confident buyers. That’s because many buyers see a price drop as a sign there’s something wrong with the house. And that assumption can turn buyers away too.
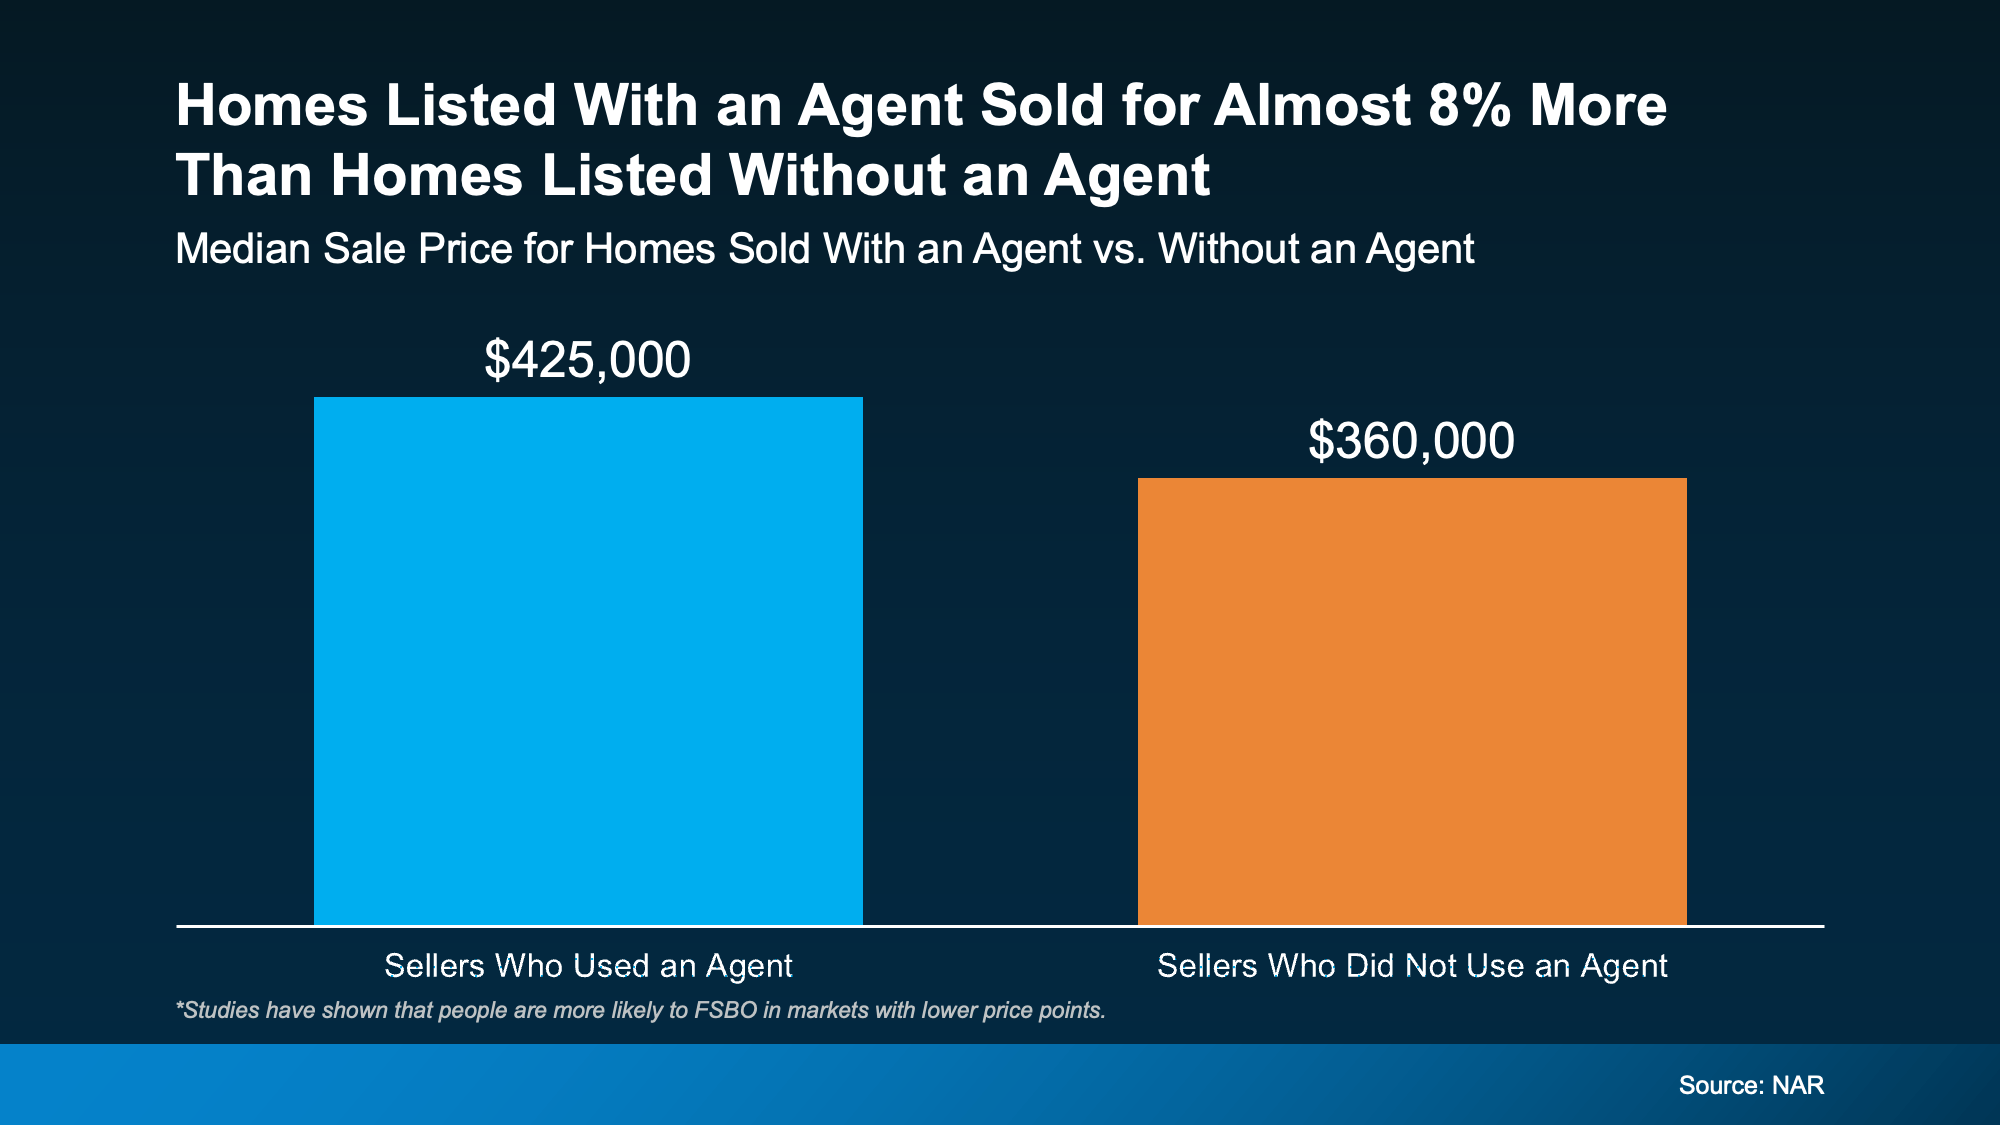
By the time your house finally sells, you may net less than if you’d priced it correctly from the start. Again, the data backs this up.
NAR shows that homes sold with an agent sell for nearly 8% more than homes sold without one.
 That’s not because agents magically add value. It’s because they have the expertise needed to get it right. The price. The prep. The presentation. And the paperwork.
Nail all of that from day one, and you’ll be set up to get as much money as you can out of your sale.
So, even though you thought selling without an agent meant saving money, that’s not necessarily true. The facts show selling on your own can mean selling for less in the long run. And that may be enough to totally change your perspective.
Bottom Line
Today, the biggest risk of selling without an agent isn’t the paperwork or the hassle. It’s the price. And once pricing goes wrong, it’s hard to course correct.
So, if you’re thinking about selling and want to understand what your home would realistically go for in today’s market, connect with a local agent. A quick pricing conversation now can save you from much bigger regrets later.


 How an Agent Can Help